DesignCliq’s actionable analytics quantify and improve business performance, enabling you to build your email data base and cost-effectively optimize targeted marketing campaigns.
Our registration rates average an astounding 40 to 45 percent, compared to the average internet conversion rate of 4 to 5 percent, and our detailed registration reports furnish you with the names, email addresses and zip codes of consumers who are focused on decorating needs and want to hear from you.
More than one third who register will purchase within 12 months, with sales tickets that are 31 percent higher than store average. These consumers are 98 percent female with a younger profile, and 79 percent have never visited your store before.
You get access to important registration and analytics data as part of your Design Cliq services.
REGISTRATION
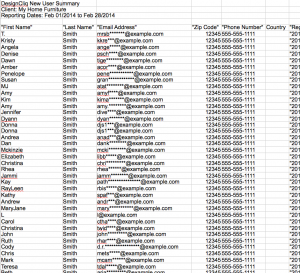
Our helpful Registration Report captures the names, email addresses, zip codes, and style preferences of Quiz registrants, allowing you to build your email database and engage in ongoing dialog with potential customers.
SUMMARY REPORT
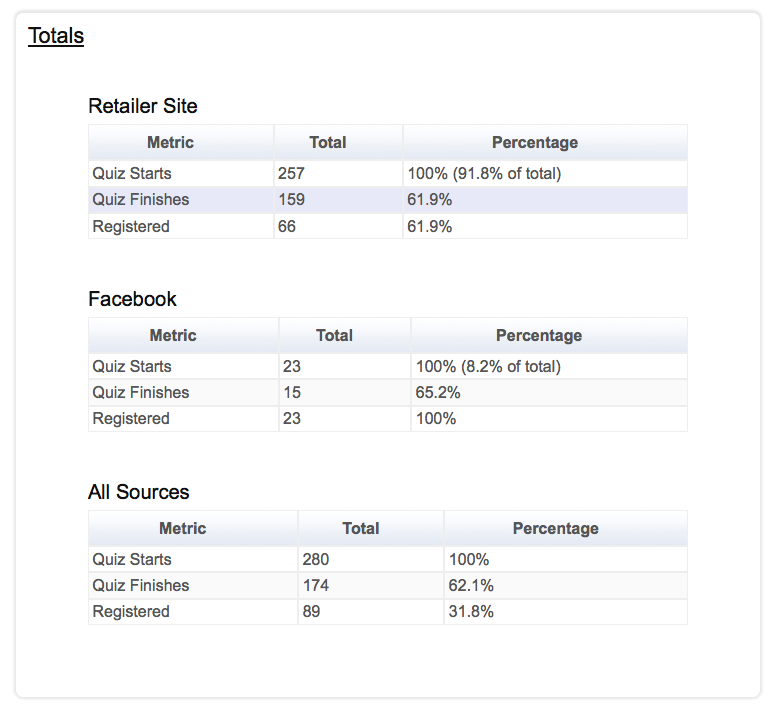
See at a glance how many people started the quiz, finished it, and registered. If you’re using our Facebook App, you can see data from your website and Facebook both individually and aggregated.
USER REGION
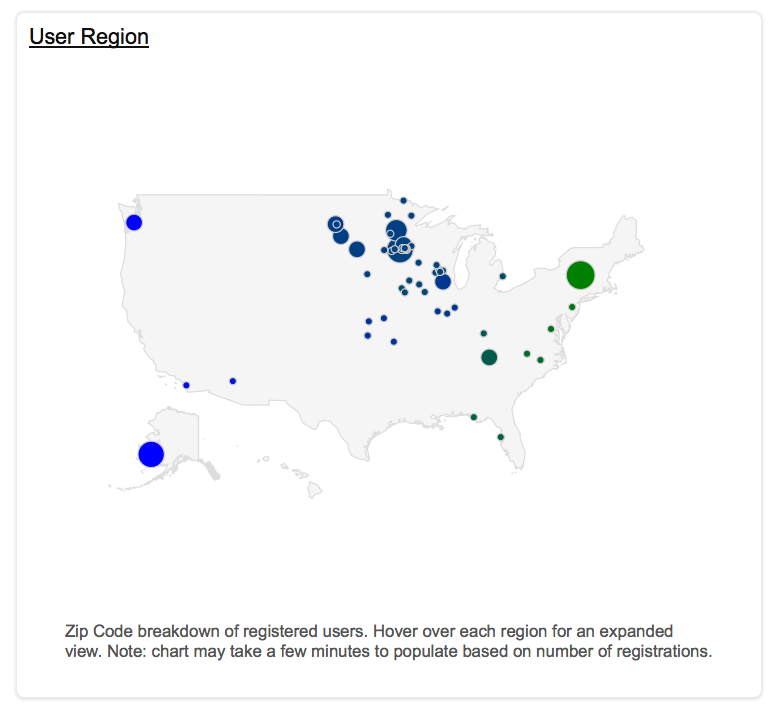
Quiz registrants’ locations are identified by zip code to maximize marketing efforts.
STYLE PREFERENCE
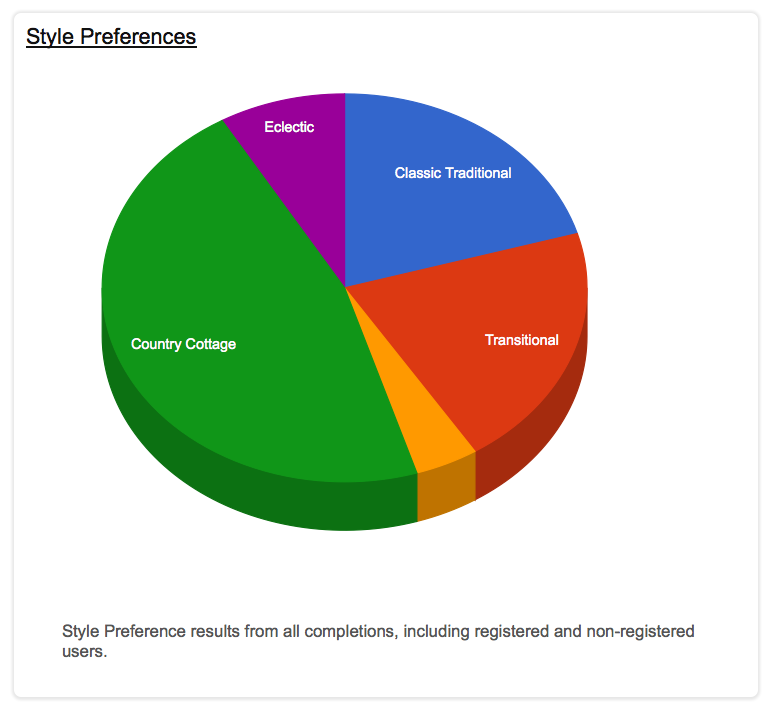
Your site visitors’ style preferences are clearly broken out enabling you to optimize buying and marketing decisions.
REGISTRATION TRENDS
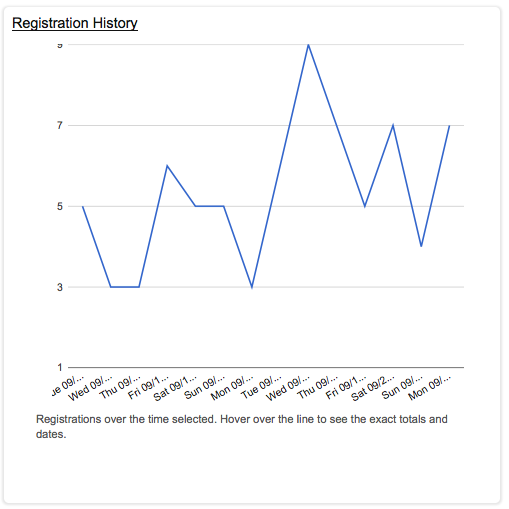
Quiz registrations are tracked over time so you can see the real-time impact of marketing strategies featuring the quiz.
